Creating An Automated Backtesting Script#
Motivation And Context#
The replay feature in SC can be useful for backtesting. As part of your strategy development effort, in order to optimize or validate parameter stability, you sometimes need to run many replays and this can be both time consuming and error prone. SC-Py’s bridge includes methods we can use to automate this process. In this tutorial we will go demonstrate how we can use those functions for automation and create a simple optimization framework.
Learning Objectives#
How to work with the SC-Py replay API.
How to work with SC-Py functions that update the chart and study settings.
SC-Py Functions Used in this Tutorial#
User Scenario#
For this tutorial we start with the situation where you have a study that autotrades a fully automated strategy and you wish to backtest and test how the system behaves under different parameters.
For our example we will use a simple ma crossover strategy that includes the following specification
Trades ES on an intraday chart
Includes a Fast MA and Slow MA
Long signal - when the fast ma crosses the slow from below
Short signal - when the fast ma crosses the slow from above
Has a stop and target defined in the SC trade window
Position size is fixed and defined in the study settings
The user starts with the fast ma set to 10 and the slow ma set to 30 and a 10 min chart but is wondering what would happen if we use different ma settings and different chart timeframes.
One way to do that is run replays with different permutations for each of those 3 parameters. The user decides to run a 2 month backtest for the following values
Fast MA Period |
Slow MA Period |
Minutes Per Bar |
|---|---|---|
10 |
30 |
10 |
20 |
60 |
10 |
30 |
90 |
10 |
10 |
30 |
30 |
20 |
60 |
30 |
20 |
90 |
30 |
In total the user needs to run 6 backtest replays. The general workflow would look something like this
Set the settings for 10, 30, 10 (i.e., using the values in the first row in the table)
Scroll the chart to the beginning
Start the replay
Wait for the replay to finish
Save the trades to a file
Repeat steps 1-5 for next set of parameters. This would be done 6 times.
This is a form of brute force optimization and can be fine for a few runs. But if you are doing this at scale, running it many times over long periods, it can be time consuming and error prone.
In this tutorial we will show how this can be automated using SC-Py.
Setting Up Sierra Chart#
First we must create the SC custom study. Since this is an SC-Py tutorial, not an ACSIL tutorial, you shall simply be given this zip with the DLL and the .cpp to satiate your curiosity.
Now put the DLL into your SierraChart/Data directory and start up SierraChart.
Open an ES intraday chart, and apply the Simple MA Crossover custom study and the SC-dX custom study with the key A. Make sure you note the ID of the Simple MA Crossover custom study for later. If it was applied first it should be ID 1.
Implementing The Script#
The script we want to build can be sketched into a few steps:
Set the two MA periods and the chart timeframe.
Start the replay.
Wait for the replay to finish.
Save the trades.
Go back to step 1 with a new parameter set.
With that list we can create a skeleton of our python script:
 1from trade29.sc import SCBridge, constants
 2import datetime as dt
 3
 4bridge = SCBridge()
 5
 6# (fast_ma_period, slow_ma_period, minutes_per_bar)
 7param_sets = [
 8    (10, 30, 30),
 9    (20, 60, 10),
10    (30, 90, 10),
11    (10, 30, 30),
12    (20, 60, 30),
13    (20, 90, 30),
14]
15
16# Later we want to save our trades here
17trades_sets = []
18
19for param_set in param_sets:
20
21    # Set parameters
22
23    # Start the replay
24
25    while(True):
26        # Wait for replay to be over
27        pass
28
29    # Append data to the trades list
Setting the parameters#
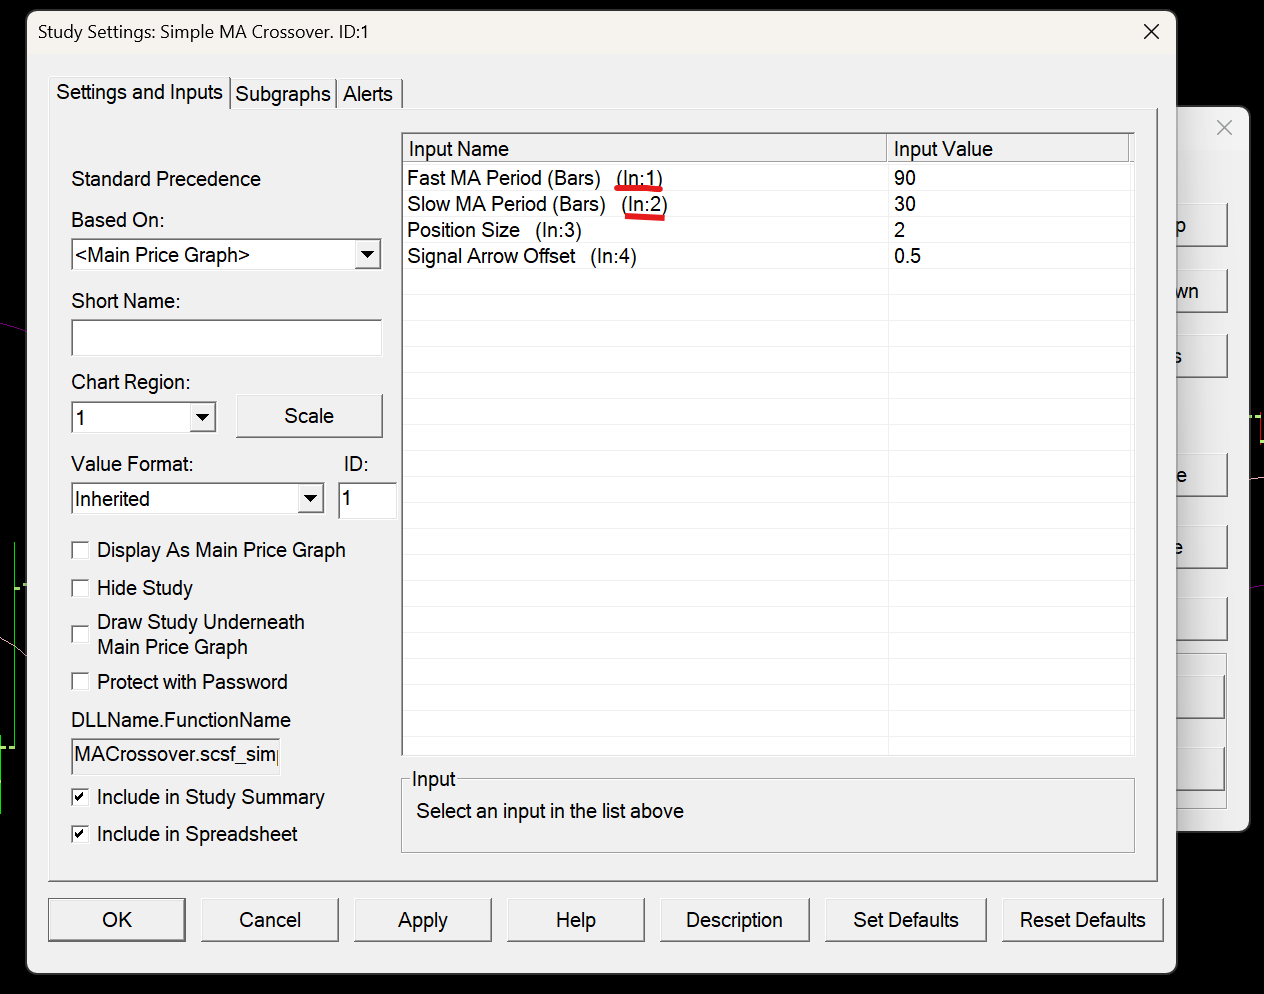
The set_chart_study_input() method can be used to set study inputs. Note how this method wants an index for the input to set. This is a 1-based index, and inspecting the study inputs in Sierra Chart shows that the period for the fast MA is input 1 and the period for the slow MA is input 2:
Make sure you use the right ID for the Simple MA Crossover custom study.
19for param_set in param_sets:
20
21    # Set parameters
22    fast_ma_period = param_set[0]
23    slow_ma_period = param_set[1]
24    minutes_per_bar = param_set[2]
25
26    print(f'Running backtest with MA periods {fast_ma_period}, {slow_ma_period} and {minutes_per_bar} minutes per bar...')
27
28    bridge.set_chart_study_input(
29        key='A',
30        study_id = 1,
31        input_index = 1,
32        value = fast_ma_period,
33    )
34
35    bridge.set_chart_study_input(
36        key='A',
37        study_id = 1,
38        input_index = 2,
39        value = slow_ma_period
40    )
41
42    # Start the replay
43
44    while(True):
45        # Wait for replay to be over
46        pass
47
48    # Append data to the trades list
Next we need to set the period of the chart. For this we use the set_intraday_bar_period_parameters() method. We want to use period type 0, which is for time based period, and we must note that the period is given in seconds per bar, so we need to multiply our minutes per bar by 60.
19for param_set in param_sets:
20
21    # Set parameters
22    fast_ma_period = param_set[0]
23    slow_ma_period = param_set[1]
24    minutes_per_bar = param_set[2]
25
26    print(f'Running backtest with MA periods {fast_ma_period}, {slow_ma_period} and {minutes_per_bar} minutes per bar...')
27
28    bridge.set_chart_study_input(
29        key='A',
30        study_id = 1,
31        input_index = 1,
32        value = fast_ma_period,
33    )
34
35    bridge.set_chart_study_input(
36        key='A',
37        study_id = 1,
38        input_index = 2,
39        value = slow_ma_period
40    )
41
42    bridge.set_intraday_bar_period_parameters(
43        'A',
44        0,
45        minutes_per_bar * 60
46    )
47
48    # Start the replay
49
50    while(True):
51        # Wait for replay to be over
52        pass
53
54    # Append data to the trades list
At this point you should run this script and check to see that the study parameters and timeframe have changed.
Starting The Replay#
SC-Py provides a bridge method start_replay() for starting replays. We can run replays really fast, since all of our trading logic is happening in Sierra Chart.
For testing, we will simply run a replay starting 2 days from the current time, but obviously in a real testing scenario you would want a constant time so each backtest can start at exactly the same time.
19for param_set in param_sets:
20
21    # Set parameters
22    fast_ma_period = param_set[0]
23    slow_ma_period = param_set[1]
24    minutes_per_bar = param_set[2]
25
26    print(f'Running backtest with MA periods {fast_ma_period}, {slow_ma_period} and {minutes_per_bar} minutes per bar...')
27
28    bridge.set_chart_study_input(
29        key='A',
30        study_id = 1,
31        input_index = 1,
32        value = fast_ma_period,
33    )
34
35    bridge.set_chart_study_input(
36        key='A',
37        study_id = 1,
38        input_index = 2,
39        value = slow_ma_period
40    )
41
42    bridge.set_intraday_bar_period_parameters(
43        'A',
44        0,
45        minutes_per_bar * 60
46    )
47
48    # Start the replay
49    bridge.start_replay('A', dt.datetime.now() - dt.timedelta(days=2), replay_speed=15000)
50
51    while(True):
52        # Wait for replay to be over
53        pass
54
55    # Append data to the trades list
As with before, you should run your script and verify that a replay is being started.
Waiting For The Replay To End#
There are two methods we could potentially use to get our replay state. We have the async subscribe_to_replay_updates() and the sync get_replay_status(). In this case we could make it work with either, so I decided to use the async version because you can never use too many async examples.
First we need to create a subscription for replay updates:
16# Later we want to save our trades here
17trades_sets = []
18
19bridge.subscribe_to_replay_updates('A')
20
21response_queue = bridge.get_response_queue()
22
23response_queue.get() # Throw away the initial response
There are a few things to note about the subscribe_to_replay_updates(). Firstly, by default, it will only send us the replay status immediately after we make the subscription, and every time the status changes. Thus we need to throw away that first subscription, because we only need updates after we start the replay.
Now, since we only get updates when the status changes, after the replay starts we can simply filter the response queue until we get told that the replay has stopped:
57    while(True):
58        # Wait for replay to be over
59        ret = response_queue.get()
60        if ret.replay_status == constants.ReplayStatus.REPLAY_STOPPED:
61            break
62
63    print('Replay over!')
64
65    # Append data to the trades list
Saving The Trades#
Finally we can use the get_flat_to_flat_trade_list() method to get all of the trades we performed. By default, the start_replay() method will clear trade history data, so we dont need to filter the trade list, as it will only include trades since the replay started! Thus we can get our trades, and at the end of the script save them all to files:
57    while(True):
58        # Wait for replay to be over
59        ret = response_queue.get()
60        if ret.replay_status == constants.ReplayStatus.REPLAY_STOPPED:
61            break
62
63    print('Replay over!')
64
65    # Append data to the trades list
66    print('Fetching data...')
67    trades_sets.append(bridge.get_flat_to_flat_trade_list('A').as_df())
68
69bridge.stop()
70
71for i, trades_set in enumerate(trades_sets):
72    param_set = param_sets[i]
73    trades_set.to_csv(f'{param_set[0]}-{param_set[1]}-{param_set[2]}-trades.csv')
Our script is now fully implemented!
Conclusion#
We did alot this tutorial. We changed subgraph inputs through SC-Py, and changed the chart timeframe. We learned about starting replays, detecting when they end, and getting trade lists. All of this culminated in a script that automates a very tedious testing process, leaving us with a series of CSVs that we can analyse to decide on the optimal parameters to run our strategy with.
Next Steps#
The next main step would be adding a constant start datetime thats best for your testing scenario. After you do that, you could consider adding further reporting, potentially reporting the average or cumulative P/L of trades.