Fetching Market Data#
This guide outlines the different ways to fetch data about a chart and market.
Make sure you have set up the Sierra Chart custom study as shown in Hello, World! with the key helloworld.
Scope#
Through the four SCBridge methods covered in this guide, the following data can be fetched:
Price data
Volume
Price averages
Open interest
Number of trades
Bid/ask volume
Up/down volume
Bid/ask number of trades
Other sc.BaseData arrays
Volume by price
Time and sales
Market depth
Market depth pulling/stacking
Background Preamble#
There are two important forms that data will come in: the form of Snapshots and Incremental Updates.
When snapshot updates are sent, they contain only current information. On the other hand, incremental updates contain current information and all historical information not sent yet.
This concept will be elaborated on more later, but for now take the difference between how the snapshot MarketDepthResponse and the incremental TimeAndSalesResponse objects look as an example. As a pandas.DataFrame, MarketDepthResponse has no column for DateTime. It is not a historical collection of market depth data, it represents a single snapshot of what the market depth looks like right now. As a pandas.DataFrame, TimeAndSalesResponse has only two columns: DateTime and TimeAndSales. As opposed to the snapshot form of MarketDepthResponse, the TimeAndSalesResponse is a historical collection of data. Incremental data is simply a historical record of many snapshots.
Get and Subscribe#
Get methods are the simplest. You call them from the bridge and they return a response.
Let’s try calling get_chart_data(). This method can be used for a variety of purposes, it can:
Fetch price data (or any
SCBaseDatafor that matter)Fetch subgraph data from one or more studies
Fetch volume by price data
Let’s suppose we want to get the high and low price of the last 20 bars. In a new python shell:
>>> from trade29.sc import SCBridge
>>> from trade29.sc import constants
>>> bridge = SCBridge()
>>> price_data_to_fetch = [constants.SCBaseData.SC_HIGH, constants.SCBaseData.SC_LOW] # make a list of price data we want
>>> # we supply the get_chart_data method with the same key as the custom study
>>> ret = bridge.get_chart_data(key='helloworld', base_data=price_data_to_fetch, historical_bars=20)
You can try printing the resulting ChartDataResponse’s raw data by accessing the rdata property.
>>> print(ret.rdata)
All responses have their raw data accessible in dictionary form like this, but it is usually too messy to do much with. ChartDataResponse has a handy method as_df() that will return a much more digestible pandas DataFrame.
>>> df = ret.as_df()
>>> # pandas DataFrames are a very powerful data structure!
>>> df # print the DataFrame to the shell
             DateTime  BarIndex  IsBarClosed     High      Low
0 2024-06-06 17:33:00     20517         True  5361.25  5360.25
1 2024-06-06 17:34:00     20518         True  5361.50  5360.25
2 2024-06-06 17:35:00     20519         True  5361.25  5360.50
3 2024-06-06 17:36:00     20520         True  5362.75  5361.00
4 2024-06-06 17:37:00     20521         True  5363.50  5362.00
5 2024-06-06 17:38:00     20522         True  5363.25  5362.50
6 2024-06-06 17:39:00     20523         True  5363.25  5362.25
7 2024-06-06 17:40:00     20524         True  5362.75  5361.50
8 2024-06-06 17:41:00     20525         True  5361.75  5360.75
9 2024-06-06 17:42:00     20526        False  5361.25  5360.75
We can see we got the requested High and Low data.
This Get method is nice for pulling data for historical analysis, but lets suppose that we wanted a constant flow of current information, perhaps to implement some real time trading strategy. In this case, constantly calling get_chart_data() is unintuitive and wasteful. We only really need to get new data, but get_chart_data() just returns whatever we ask it for. So we would have to monitor when the live bar closes and time our Get requests ourselves. Instead we have the SCBridge’s Subscription methods, namely subscribe_to_chart_data(). This method is almost the exact same in functionality to its Get counterpart, but it gives new requested data whenever it’s available, dumping it to the SCBridge’s response queue. Most Get methods have a Subscription counterpart that works similarly. Here is a worked example of how to use a Subscription method in a script that fetches for the same information as we just did in the shell.
1from trade29.sc import commands, constants
2from trade29.sc import SCBridge
3
4bridge = SCBridge()
5
6# note how the parameters for the subscription version are the same as the get version
7chart_data_id = bridge.subscribe_to_chart_data(key='helloworld',
8                                               base_data=[constants.SCBaseData.SC_HIGH,
9                                                          constants.SCBaseData.SC_LOW])
We store the unique request id returned by the method. Now all new high and low price data will be sent to the bridge response queue. The response queue can be gotten with get_response_queue() and is an iterable python Queue.
10response_queue = bridge.get_response_queue()
11
12while True:
13
14    response = response_queue.get()
15
16    chart_data_df = response.as_df()
17
18    chart_data_df
19
20    # do something with chart data
The two other subscribe functions of interest are subscribe_to_time_and_sales() and subscribe_to_market_depth(). Let’s try getting time and sales data. First we would go back and add a line to also subscribe to time and sales.
 1from trade29.sc import constants
 2from trade29.sc import SCBridge
 3
 4bridge = SCBridge()
 5
 6# note how the parameters for the subscription version are the same as the get version
 7chart_data_id = bridge.subscribe_to_chart_data(key='helloworld',
 8                                               base_data=[constants.SCBaseData.SC_HIGH,
 9                                                          constants.SCBaseData.SC_LOW])
10
11tns_id = bridge.subscribe_to_time_and_sales(key='helloworld')
Now time and sales data will also be sent to the response queue. However, since both chart data and time and sales data come through the same queue, we need some way to filter the responses for the different types of responses. That’s what saving the request ids is for. Every response has the property request_id. Let’s simply print what type of data we have and the DataFrames
12response_queue = bridge.get_response_queue()
13
14while True:
15
16    response = response_queue.get()
17
18    if response.request_id == chart_data_id:
19        print('I have price data!')
20        response.as_df()
21        # if low, buy, if high, sell
22
23
24    elif response.request_id == tns_id:
25        print('I have time and sales data!')
26        response.as_df()
27        # do something with tns data
Both of the Subscription methods we used so far are incrementally updated. By looking at the printout, we can see that the first response includes a big dump of historical data, and subsequent responses return all historical information since the last response.
Now lets try out a SCBridge method that just gives snapshots: subscribe_to_market_depth(). Let’s remove the other subscriptions so we can more clearly see what’s going on.
 1from trade29.sc import constants
 2from trade29.sc import SCBridge
 3
 4bridge = SCBridge()
 5
 6market_depth_id = bridge.subscribe_to_market_depth(key='helloworld', include_pulling_stacking=True)
 7
 8response_queue = bridge.get_response_queue()
 9
10while True:
11
12    response = response_queue.get()
13
14    if response.request_id == market_depth_id:
15        print('I have market depth data!')
16        response.as_df()
We added a subscription for market depth, and told it to include data on pulling-stacking. Then we simply print out the DataFrame. Running the script, you can see now that each response only includes a snapshot of a single moment in time, as opposed to the incremental historical records of the previous examples.
Getting Subgraph Data#
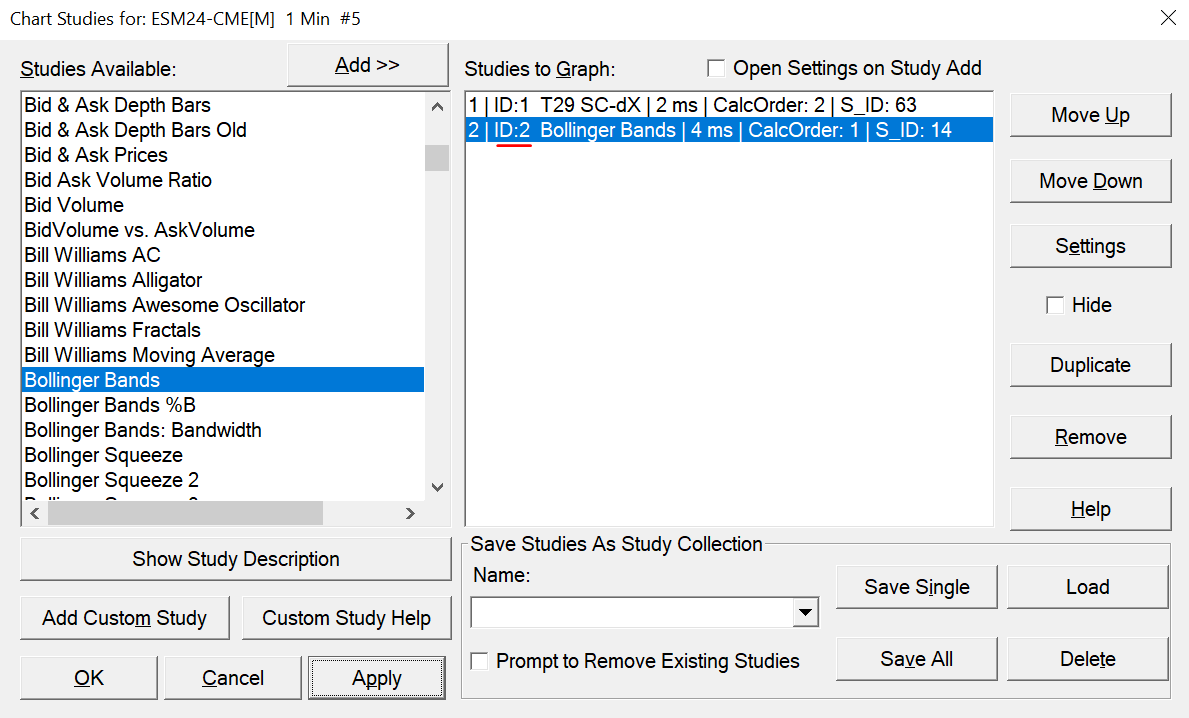
The get_chart_data() and subscribe_to_chart_data() methods can get alot more than just price data through their parameters. They can even get subgraph data! In the chart you are working with, add a study. I added Bollinger Bands. Note how in the study window each study has an ID. In my case the Bollinger Bands study is ID 2.
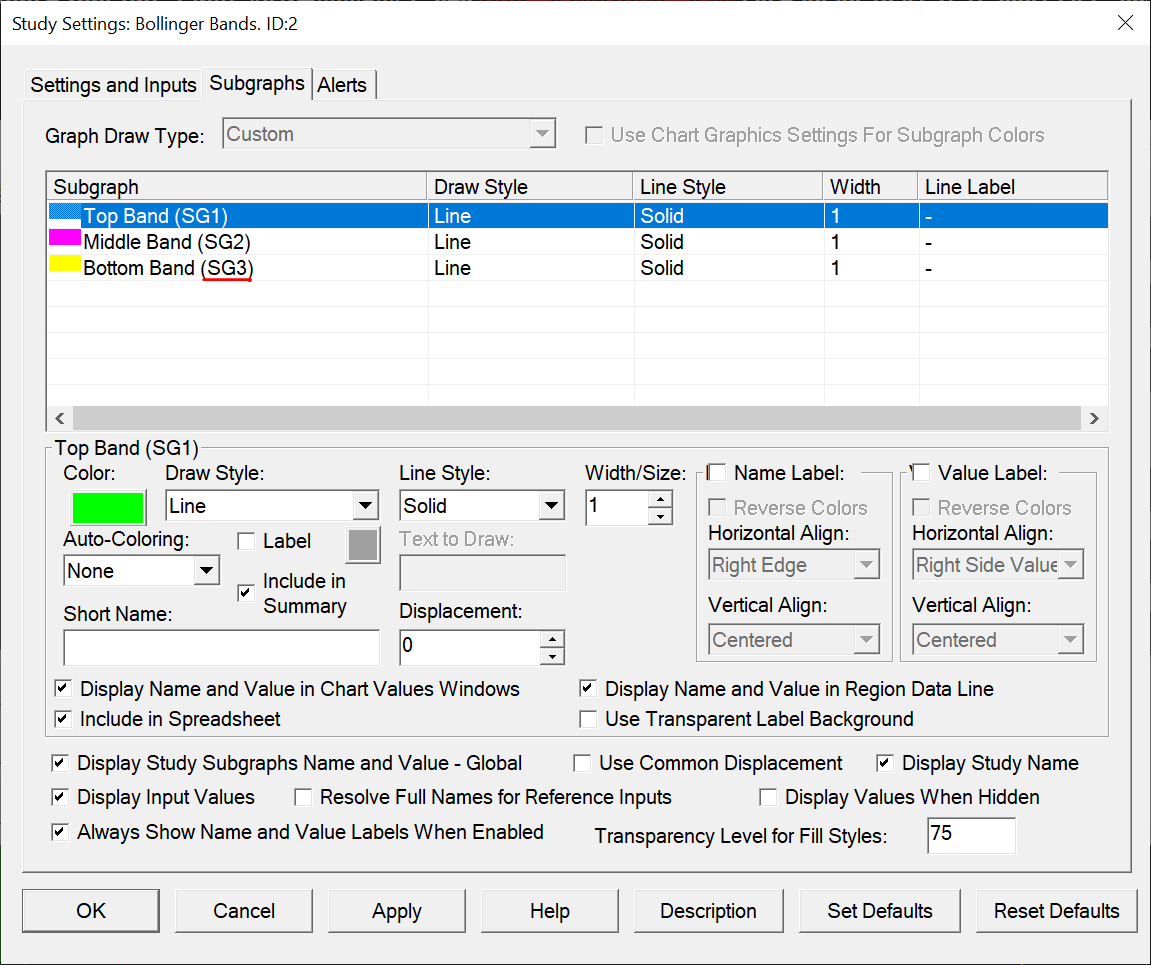
Now note how in the Study Settings window under the Subgraphs tab each subgraph has an ID. In the Bollinger Bands study the lower band is ID 3.
Now that we know the IDs we want to fetch, in a new Python shell:
>>> from trade29.sc import SCBridge, SubgraphQuery
>>> from trade29.sc import constants
>>> bridge = SCBridge()
>>> # get_chart_data wants a list of SubgraphQuery
>>> sg_to_fetch = [SubgraphQuery(study_id=2, subgraphs=[3])]
>>> ret = bridge.get_chart_data(key='helloworld', sg_data=sg_to_fetch)
>>> ret.as_df()
             DateTime  BarIndex  IsBarClosed  ID2.SG3
0 2024-06-06 17:52:00     19156         True  5359.02
1 2024-06-06 17:53:00     19157         True  5359.00
2 2024-06-06 17:54:00     19158         True  5358.75
3 2024-06-06 17:55:00     19159         True  5358.45
4 2024-06-06 17:56:00     19160         True  5358.45
5 2024-06-06 17:57:00     19161         True  5358.51
6 2024-06-06 17:58:00     19162         True  5358.82
7 2024-06-06 17:59:00     19163         True  5359.07
8 2024-06-06 18:00:00     19164         True  5359.28
9 2024-06-06 18:01:00     19165        False  5359.57
We can now see a column in the DataFrame for the lower band.
The constructor for SubgraphQuery takes a list of integers for its subgraphs parameter. This makes it very easy to fetch more than one subgraph of interest:
>>> sg_to_fetch = [SubgraphQuery(study_id=2, subgraphs=range(1, 4))]
>>> ret = bridge.get_chart_data(key='helloworld', sg_data=sg_to_fetch)
>>> ret.as_df()
             DateTime  BarIndex  IsBarClosed  ID2.SG1  ID2.SG2  ID2.SG3
0 2024-06-06 17:52:00     19156         True  5361.43  5360.23  5359.02
1 2024-06-06 17:53:00     19157         True  5361.55  5360.28  5359.00
2 2024-06-06 17:54:00     19158         True  5362.02  5360.38  5358.75
3 2024-06-06 17:55:00     19159         True  5362.60  5360.52  5358.45
4 2024-06-06 17:56:00     19160         True  5362.70  5360.57  5358.45
5 2024-06-06 17:57:00     19161         True  5362.76  5360.63  5358.51
6 2024-06-06 17:58:00     19162         True  5362.70  5360.76  5358.82
7 2024-06-06 17:59:00     19163         True  5362.63  5360.85  5359.07
8 2024-06-06 18:00:00     19164         True  5362.61  5360.94  5359.28
9 2024-06-06 18:01:00     19165        False  5362.50  5361.03  5359.57
Note how the sg_data parameter of get_chart_data() is a list too, so it is very easy to fetch more than one subgraph at a time. Add a new study to the chart. I added a Simple Moving Average; its ID is 3 and it has one subgraph with ID 1. In the shell same as last time, but adding a new SubgraphQuery to the list:
>>> sg_to_fetch = [SubgraphQuery(study_id=2, subgraphs=range(1, 4)),
>>>                SubgraphQuery(study_id=3, subgraphs=[1])]
>>> ret = bridge.get_chart_data(key='helloworld', sg_data=sg_to_fetch)
>>> ret.as_df()
             DateTime  BarIndex  IsBarClosed  ID2.SG1  ID2.SG2  ID2.SG3  ID3.SG1
0 2024-06-06 17:52:00     19156         True  5361.43  5360.23  5359.02  5360.23
1 2024-06-06 17:53:00     19157         True  5361.55  5360.28  5359.00  5360.33
2 2024-06-06 17:54:00     19158         True  5362.02  5360.38  5358.75  5360.45
3 2024-06-06 17:55:00     19159         True  5362.60  5360.52  5358.45  5360.63
4 2024-06-06 17:56:00     19160         True  5362.70  5360.57  5358.45  5360.63
5 2024-06-06 17:57:00     19161         True  5362.76  5360.63  5358.51  5360.73
6 2024-06-06 17:58:00     19162         True  5362.70  5360.76  5358.82  5360.83
7 2024-06-06 17:59:00     19163         True  5362.63  5360.85  5359.07  5360.92
8 2024-06-06 18:00:00     19164         True  5362.61  5360.94  5359.28  5361.02
9 2024-06-06 18:01:00     19165        False  5362.50  5361.03  5359.57  5361.08
Fetching Volume by Price#
get_chart_data() can also fetch volume by price data. In a Python shell:
>>> from trade29.sc import SCBridge
>>> bridge = SCBridge()
>>> ret = bridge.get_chart_data(key='helloworld', include_volume_by_price=True)
>>> ret.as_df()
             DateTime  BarIndex  IsBarClosed                                      VolumeByPrice
0 2024-06-06 17:52:00     19156         True       Price  AskVol  BidVol  TotalVolume  NumOf...
1 2024-06-06 17:53:00     19157         True       Price  AskVol  BidVol  TotalVolume  NumOf...
2 2024-06-06 17:54:00     19158         True       Price  AskVol  BidVol  TotalVolume  NumOf...
3 2024-06-06 17:55:00     19159         True       Price  AskVol  BidVol  TotalVolume  NumOf...
4 2024-06-06 17:56:00     19160         True       Price  AskVol  BidVol  TotalVolume  NumOf...
5 2024-06-06 17:57:00     19161         True       Price  AskVol  BidVol  TotalVolume  NumOf...
6 2024-06-06 17:58:00     19162         True       Price  AskVol  BidVol  TotalVolume  NumOf...
7 2024-06-06 17:59:00     19163         True       Price  AskVol  BidVol  TotalVolume  NumOf...
8 2024-06-06 18:00:00     19164         True       Price  AskVol  BidVol  TotalVolume  NumOf...
9 2024-06-06 18:01:00     19165        False       Price  AskVol  BidVol  TotalVolume  NumOf...
# volume by price is its own DataFrame, print out the most recent one:
>>> ret['VolumeByPrice'][9]
     Price  AskVol  BidVol  TotalVolume  NumOfTrades
0  5360.00       0       5            5            4
1  5360.25      65      64          129           95
2  5360.50      44     138          182          111
3  5360.75      66      72          138           98
4  5361.00      11      33           44           33
5  5361.25       2       0            2            2