Creating An Automated Pairs Trading Strategy#
Motivation and Context#
There are circumstances where a single script requires access to multiple instruments and multiple charts. Some examples where this requirement comes up include:
Running some strategy on multiple markets
Managing a portfolio of strategies where each strategy is on its own market
Strategies that rely on a relationship between instruments
Strategies that require multiple bar timeframes
There are other examples but the common theme amongst them is the need for a single script that works with multiple instruments or multiple charts.
Working with multiple instruments raises various challenges and questions:
How to setup the charts in a way that is efficient, useful and makes our programming easy and reliable?
How to access data? Do we use async, sync?
Should we work with each instrument separately or merge it?
How to handle multiple timeframes? This can be different vs. multiple instruments on a single timeframe
How do we submit orders to multiple instruments? How do track positions for each instrument?
This is broad subject with many nuances, this tutorial will cover some of them.
Learning objectives#
Working with multiple charts on a single timeframe
Accessing more than one chart in a single script where all the charts are on the same timeframe
Submitting orders to multiple charts
Trading strategy implementation flow - we demonstrate a useful blueprint that many trading strategy implementations follow
Implement a simple and basic pairs trading strategy
Overview of The Pairs Trading Strategy#
Pais trading is a simple mean reverting strategy. At a high level it follows the following steps:
Find two assets A and B that tend to move together. Examples of this are Ford and GM, ES and NQ, etc.
Monitor for situations where they diverge from one another
When that happens, we sell one asset and buy the other
Wait for the assets to come back together and exit
In more technical terms, for this turotial we will be trading futures pairs on a 1H chart.
Firstly we calculate a measure of spread, the ratio \(S=\frac AB\). We then calculate the 15-bar MA and standard deviation of the spread and get the z-score \(z_S\). With that we can generate our entry signals. If the z-score of the spread crosses above \(2\), we have that our spread is exceptionally high, and thus we can bet that the price of A will go down and/or the price of B will go up. We call this shorting the spread. Similarly, if \(z_S\) crosses below \(-2\) we expect the price of A to go up and/or the price of B to go down. We call this longing the spread.
We will use fixed sizing for entering the markets, and exiting will be done once \(z_S\) crosses \(0\) or when a trade has gone on for longer than 7 bars by simply flattening our position.
Now that we understand the general logic behind the strategy we can start thinking about how to design the code on a high level.
Preparing the Charts#
For this example, let our asset A be ES and our asset B be NQ.
The first design consideration we have to make is when we are going to merge the hourly data from asset A and asset B. We have 2 options:
Merge them in Sierra Chart using the
Add Additional Symbolstudy.Merge them in python by setting up two
subscribe_to_chart_data()requests.
Each option has its own limitations and strength. The main consideration is the alignment of the data. In general Sierra Chart is really good at that and there shouldnt be any alignment problems with the Add Additional Symbol study in that respect. The drawback however is that Add Additional Symbol will force the additional symbol to be the same timeframe. Since we want to work in the same timeframe anyways for both assets, we will utilize the supreme alignment of merging the data in Sierra Charts with the Add Additional Symbol study.
Thus setup two hourly charts, one for asset A (ES) and one for asset B (NQ). Add the SC-dX custom study to both, setting the key for A to A and the key for B to B.
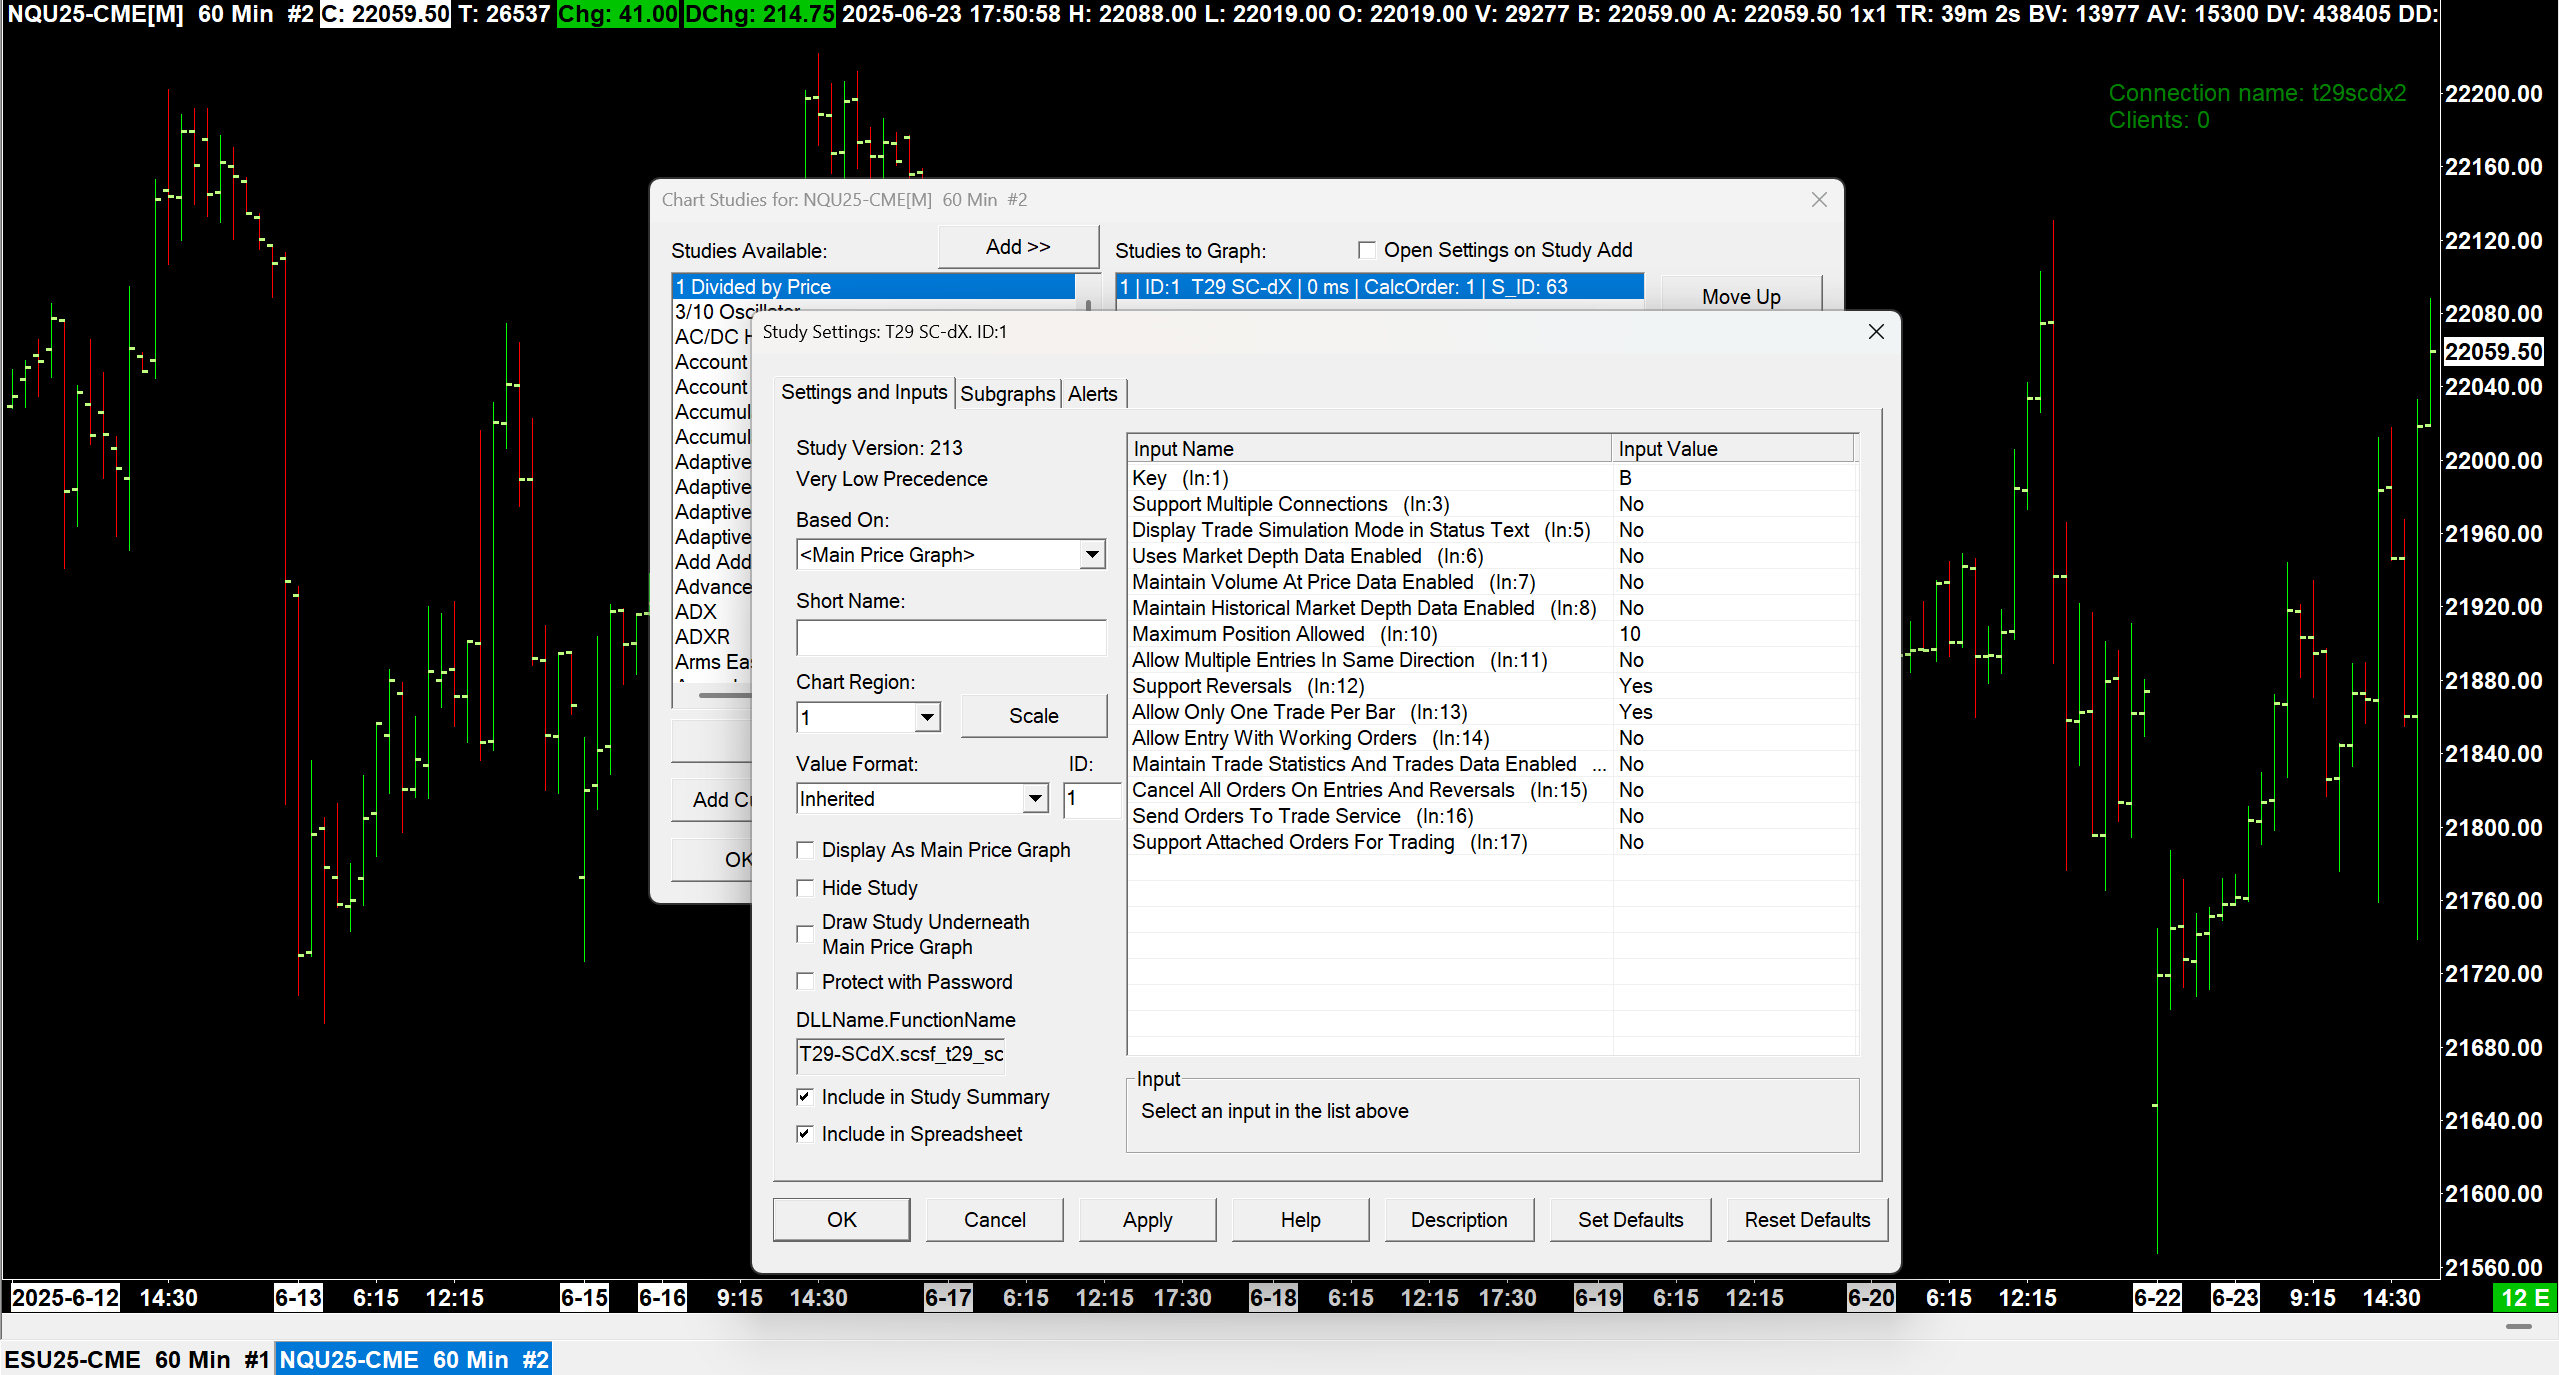
Why do we open two charts?
We still open two charts even though we are only fetching data from one. This is so we can trade both, as the SCBridge() does not yet have a method for trading an arbitrary symbol.
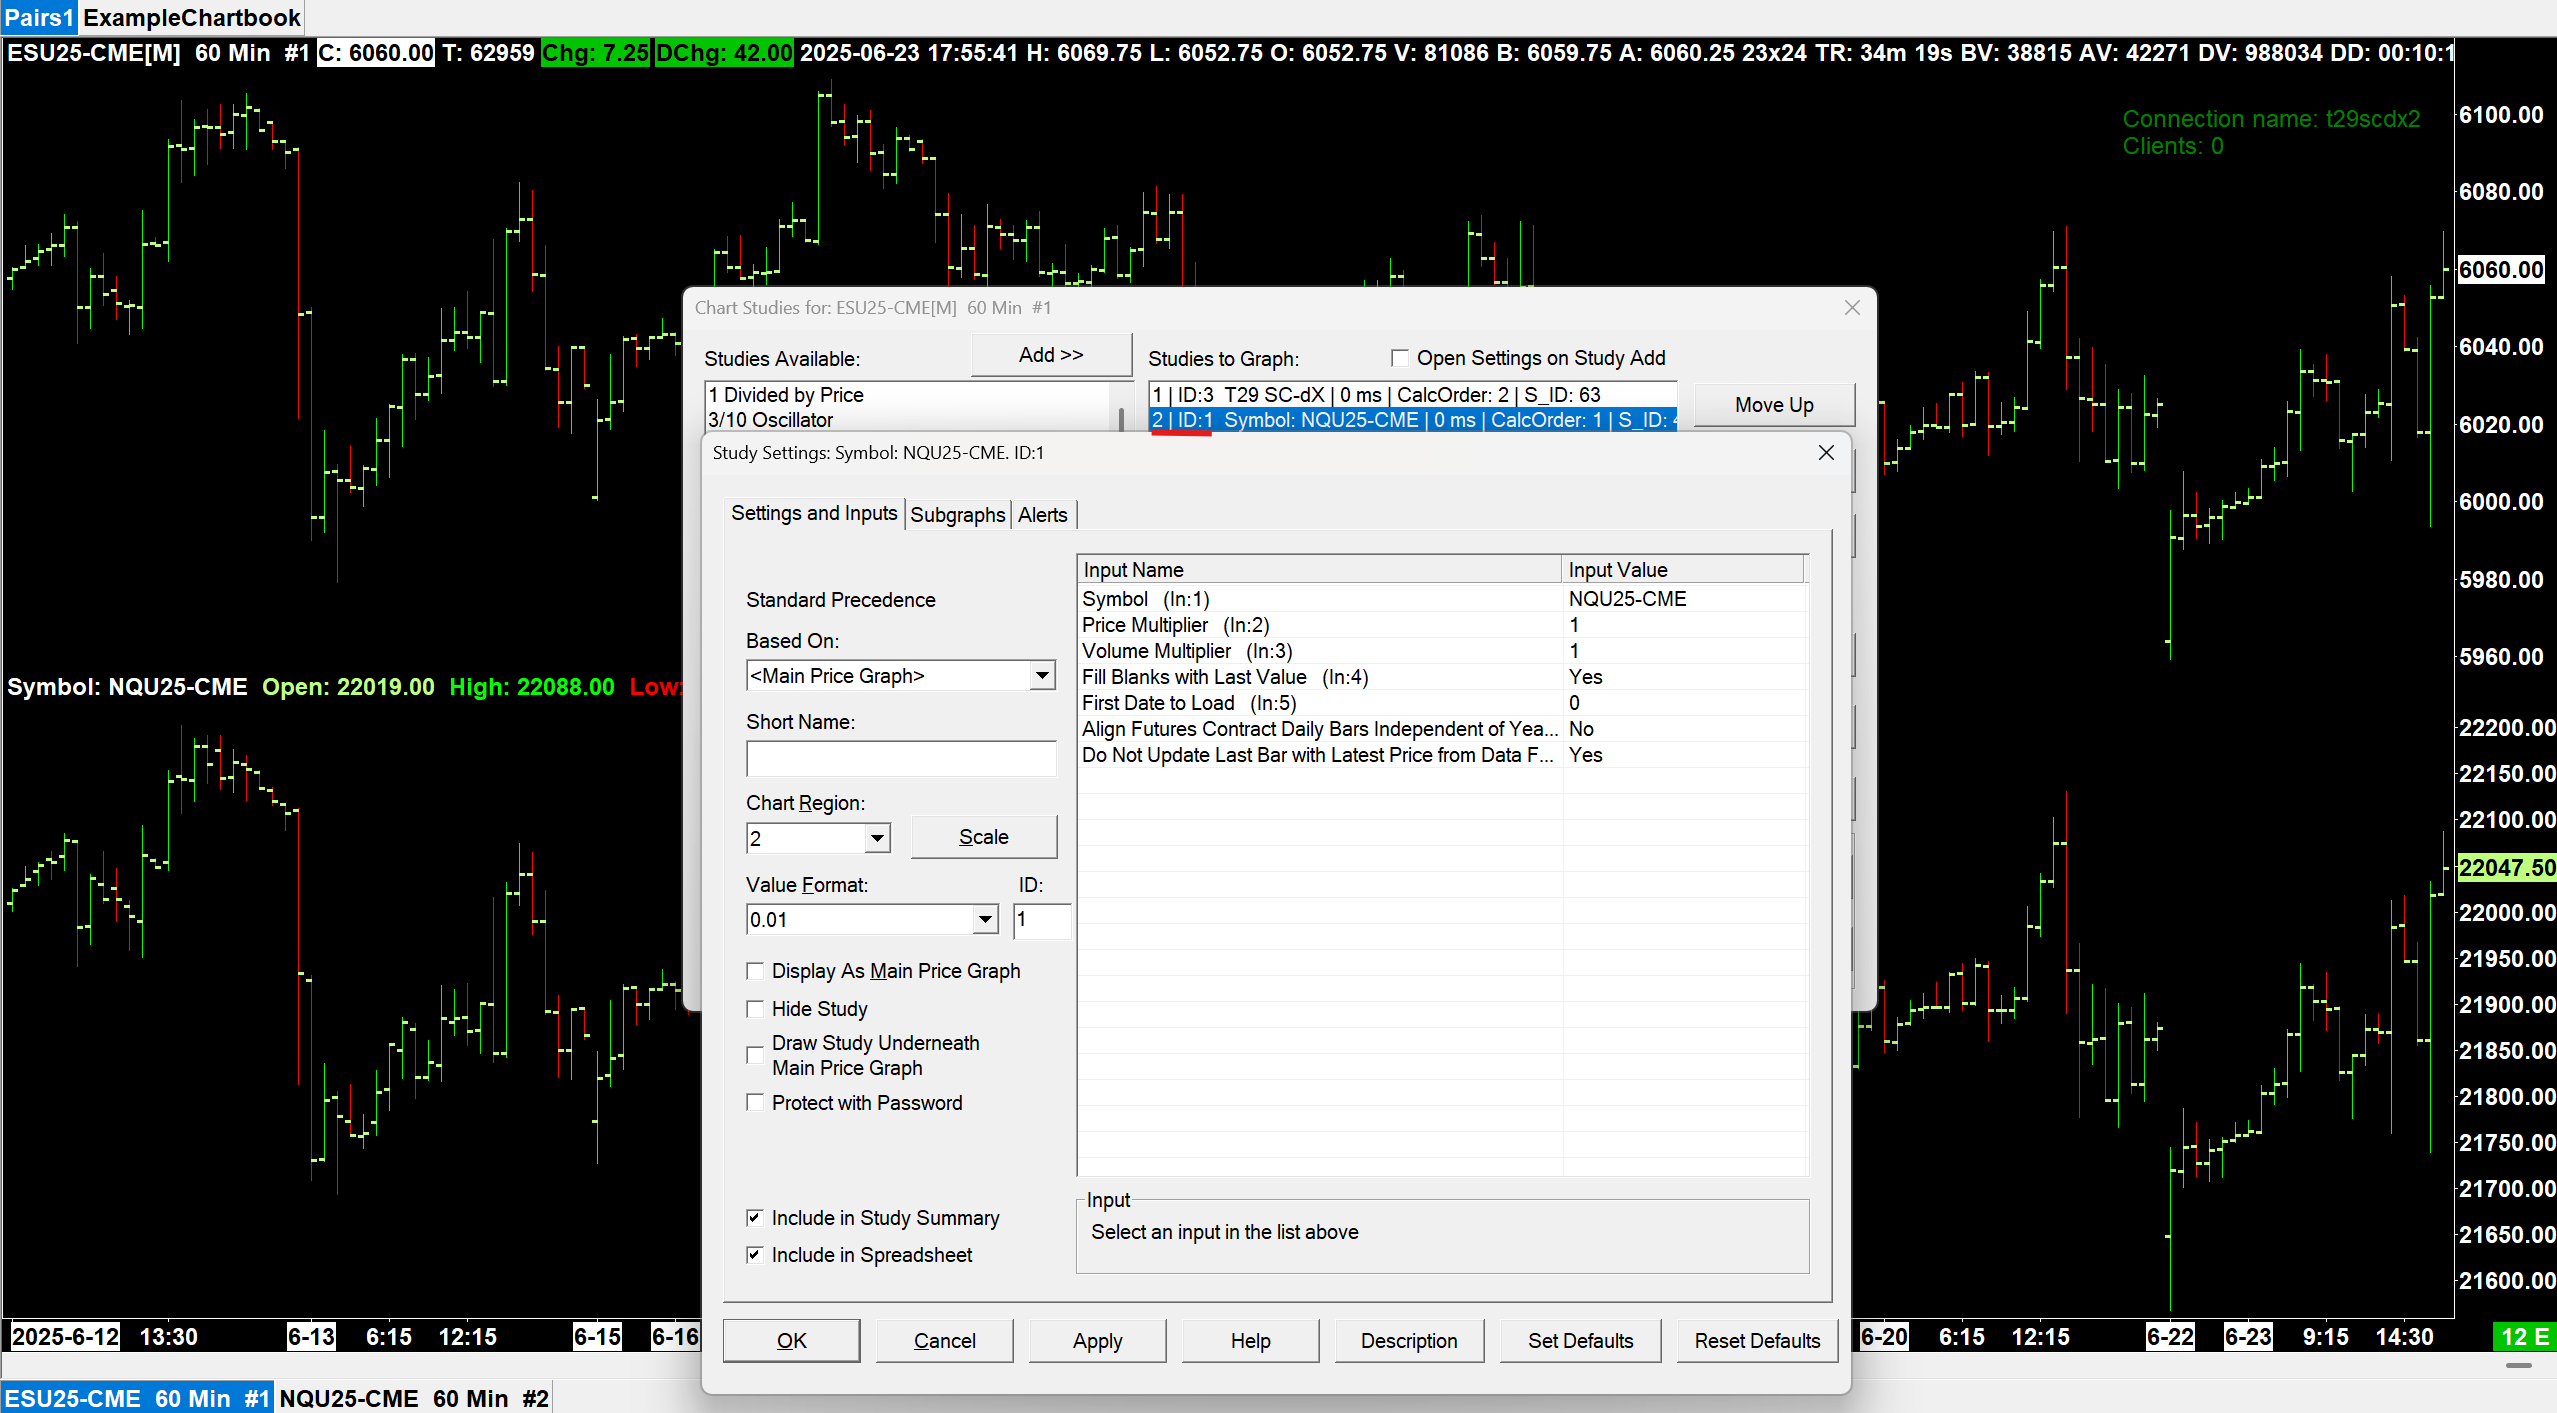
Next add the Add Additional Symbol study to chart A, filling in the symbol parameter as symbol B. Take note of the ID of the study for later.
Implementing The Strategy#
In general almost all automated trading strategies can be broken down into 4 parts:
Prepare the data (prices, position size)
Calculate the indicator(s) (spread)
Generate the signals (entry/exit signals outlined above)
Trade the signals
Thus we start with the template file:
 1from trade29.sc import SCBridge, constants, SubgraphQuery
 2
 3bridge = SCBridge()
 4
 5# Prepare data
 6
 7# Calculate indicators from the data
 8
 9# Generate signals
10
11# Trade the signals
Prepare The Data#
We want to trade on bar close, thus we use the handy async subscribe_to_chart_data() method to serve us data on bar close. Make sure you remember the ID of the Add Additional Symbol study for the constant!
 1from trade29.sc import SCBridge, constants, SubgraphQuery
 2
 3bridge = SCBridge()
 4
 5# Helper Functions
 6
 7# Constants
 8
 9ADD_ADDITIONAL_SYMBOL_STUDY_ID = 1
10LOOKBACK_PERIOD = 15
11ENTRY_STANDARD_DEVIATIONS = 2
12MAX_TRADE_BARS = 7
13TRADE_QUANTITY_A = 3
14TRADE_QUANTITY_B = 4
15
16# Prepare data
17
18subscription = bridge.subscribe_to_chart_data(
19    key = 'A',
20    base_data = [constants.SCBaseData.SC_LAST],
21    sg_data = [SubgraphQuery(ADD_ADDITIONAL_SYMBOL_STUDY_ID, [4])],
22    on_bar_close = True,
23    historical_init_bars = LOOKBACK_PERIOD,
24    realtime_update_bars = LOOKBACK_PERIOD
25)
26
27response_queue = bridge.get_response_queue()
28
29while (True):
30    response_a = response_queue.get()
31
32    prices_a = response_a.as_df()['Last']
33    prices_b = response_a.as_df()['ID1.SG4']
34
35    print(prices_a)
36    print(prices_b)
37
38    # Calculate indicators from the data
39
40    # Generate signals
41
42    # Trade the signals
Running this script, we can see the prices for asset A in the last 15 bars followed by the prices for asset B in the last 15 bars for every new bar that comes in. Now we need to decide how we will fetch position data.
We can either fetch position data asynchonously through the response queue like we do price data, or on demand through the get_position_status() method. Doing it asynchonously introduces the complexity of filtering the response queue and keeping track of our position. Getting it on demand takes a little more time when running, but ensures it is up to date and immediate, and since we are trading on bar close for very long hourly bars, that isn’t really a problem. Therefore we choose to fetch position data synchonously upon recieving new data:
29while (True):
30    response_a = response_queue.get()
31
32    prices_a = response_a.as_df()['Last']
33    prices_b = response_a.as_df()['ID1.SG4']
34
35    position_a = bridge.get_position_status('A').position_quantity
36
37    # Calculate indicators from the data
38
39    # Generate signals
40
41    # Trade the signals
Calculate The Indicator(s)#
With both of these sets of prices in Pandas series, we can quickly calculate the spreads and their 15-bar z-score:
29while (True):
30    response_a = response_queue.get()
31
32    prices_a = response_a.as_df()['Last']
33    prices_b = response_a.as_df()['ID1.SG4']
34
35    position_a = bridge.get_position_status('A').position_quantity
36
37    # Calculate indicators from the data
38
39    spread = prices_a / prices_b
40
41    avg = spread.mean()
42    stdev = spread.std()
43
44    zscore = (spread.iloc[-1] - avg) / stdev
45
46    print(zscore)
47
48    # Generate signals
49
50    # Trade the signals
Like the previous script, we can run this one and it will print the z-score of the spread each time a new bar arrives.
Generate The Signals#
We sketch 2 functions for generating entry and exit signals on a crossover:
 1from trade29.sc import SCBridge, constants, SubgraphQuery
 2
 3bridge = SCBridge()
 4
 5# Helper Functions
 6
 7# Return 1 for long signal, -1 for short signal, 0 for no signal
 8def get_entry_signal(zscore, last_zscore):
 9    return 0
10
11# Return 0 for no exit signal, 1 for signal
12def get_exit_signal(zscore, last_zscore):
13    return 0
14
15# Constants
16
17ADD_ADDITIONAL_SYMBOL_STUDY_ID = 1
18LOOKBACK_PERIOD = 15
19ENTRY_STANDARD_DEVIATIONS = 2
20MAX_TRADE_BARS = 7
21TRADE_QUANTITY_A = 3
22TRADE_QUANTITY_B = 4
23
24# Prepare data
We see now that we must keep track of the last-zscore and also implement the timeout signal:
35response_queue = bridge.get_response_queue()
36
37bars_since_entrance = 0
38
39last_zscore = 0
40
41while (True):
42    response_a = response_queue.get()
43
44    prices_a = response_a.as_df()['Last']
45    prices_b = response_a.as_df()['ID1.SG4']
46
47    position_a = bridge.get_position_status('A').position_quantity
48
49    # Calculate indicators from the data
50
51    spread = prices_a / prices_b
52
53    avg = spread.mean()
54    stdev = spread.std()
55
56    zscore = (spread.iloc[-1] - avg) / stdev
57
58    # Generate signals
59
60    entry_signal = get_entry_signal(zscore, last_zscore)
61
62    exit_signal = get_exit_signal(zscore, last_zscore)
63
64    timeout_signal = bars_since_entrance > MAX_TRADE_BARS
65
66    # Trade the signals
67
68    last_zscore = zscore
Now we can implement the crossover signal functions:
 1from trade29.sc import SCBridge, constants, SubgraphQuery
 2
 3bridge = SCBridge()
 4
 5# Helper Functions
 6
 7# Return 1 for long signal, -1 for short signal, 0 for no signal
 8def get_entry_signal(zscore, last_zscore):
 9    if (zscore >= ENTRY_STANDARD_DEVIATIONS and
10        last_zscore < ENTRY_STANDARD_DEVIATIONS):
11        return -1 # Short signal
12    if (zscore <= -ENTRY_STANDARD_DEVIATIONS and
13        last_zscore > -ENTRY_STANDARD_DEVIATIONS):
14        return 1 # Long signal
15    return 0 # No signal
16
17# Return 0 for no exit signal, 1 for signal
18def get_exit_signal(zscore, last_zscore):
19    if zscore >= 0 and last_zscore < 0:
20        return 1 # Exit signal
21    if zscore <= 0 and last_zscore > 0:
22        return 1 # Exit signal
23    return 0 # No exit signal
24
25# Constants
26
27ADD_ADDITIONAL_SYMBOL_STUDY_ID = 1
28LOOKBACK_PERIOD = 15
29ENTRY_STANDARD_DEVIATIONS = 2
30MAX_TRADE_BARS = 7
31TRADE_QUANTITY_A = 3
32TRADE_QUANTITY_B = 4
33
34# Prepare data
Trade The Signals#
First let’s sketch the logic for entering and exiting:
68    # Generate signals
69
70    entry_signal = get_entry_signal(zscore, last_zscore)
71
72    exit_signal = get_exit_signal(zscore, last_zscore)
73
74    timeout_signal = bars_since_entrance > MAX_TRADE_BARS
75
76    # Trade the signals
77
78    if position_a == 0:
79        # Not in the market
80        if entry_signal == 1:
81            # Long the spread
82            bars_since_entrance = 1
83
84        elif entry_signal == -1:
85            # Short the spread
86            bars_since_entrance = 1
87
88    else:
89        # We are in the market
90        if timeout_signal or exit_signal:
91            # Exit position
92            pass
93        else:
94            bars_since_entrance += 1
95
96    last_zscore = zscore
Simple enough. Now all that’s left is to add the buy/sell orders using submit_order() and the flattening using flatten_and_cancel(). Note that when you set the is_buy parameter for submit_order() to False it will short. Since we have our two charts and SC-dX studies open, we can simply pass the key A or B to trade on the corresponding symbol.
 68    # Generate signals
 69
 70    entry_signal = get_entry_signal(zscore, last_zscore)
 71
 72    exit_signal = get_exit_signal(zscore, last_zscore)
 73
 74    timeout_signal = bars_since_entrance > MAX_TRADE_BARS
 75
 76    # Trade the signals
 77
 78    if position_a == 0:
 79        # Not in the market
 80        if entry_signal == 1:
 81            # Long the spread
 82            bridge.submit_order(
 83                key = 'A',
 84                is_buy = True,
 85                quantity = TRADE_QUANTITY_A)
 86            bridge.submit_order(
 87                key = 'B',
 88                is_buy = False,
 89                quantity = TRADE_QUANTITY_B)
 90            bars_since_entrance = 1
 91
 92        elif entry_signal == -1:
 93            # Short the spread
 94            bridge.submit_order(
 95                key = 'A',
 96                is_buy = False,
 97                quantity = TRADE_QUANTITY_A)
 98            bridge.submit_order(
 99                key = 'B',
100                is_buy = True,
101                quantity = TRADE_QUANTITY_B)
102            bars_since_entrance = 1
103
104    else:
105        # We are in the market
106        if timeout_signal or exit_signal:
107            # Exit position
108            bridge.flatten_and_cancel('A')
109            bridge.flatten_and_cancel('B')
110        else:
111            # Still in the market
112            bars_since_entrance += 1
113
114    last_zscore = zscore
Conclusion#
And thus we are done our pairs trading strategy! Congratulations, you have started with a strategy specification, merged data from two charts in the same timeframe, traded said charts, learned a useful implementation flow that you can hopefully apply to your own endeavors in the future, and of course you now have a basic pairs trading strategy which is given in full below to check against.
  1from trade29.sc import SCBridge, constants, SubgraphQuery
  2
  3bridge = SCBridge()
  4
  5# Helper Functions
  6
  7# Return 1 for long signal, -1 for short signal, 0 for no signal
  8def get_entry_signal(zscore, last_zscore):
  9    if (zscore >= ENTRY_STANDARD_DEVIATIONS and
 10        last_zscore < ENTRY_STANDARD_DEVIATIONS):
 11        return -1 # Short signal
 12    if (zscore <= -ENTRY_STANDARD_DEVIATIONS and
 13        last_zscore > -ENTRY_STANDARD_DEVIATIONS):
 14        return 1 # Long signal
 15    return 0 # No signal
 16
 17# Return 0 for no exit signal, 1 for signal
 18def get_exit_signal(zscore, last_zscore):
 19    if zscore >= 0 and last_zscore < 0:
 20        return 1 # Exit signal
 21    if zscore <= 0 and last_zscore > 0:
 22        return 1 # Exit signal
 23    return 0 # No exit signal
 24
 25# Constants
 26
 27ADD_ADDITIONAL_SYMBOL_STUDY_ID = 1
 28LOOKBACK_PERIOD = 15
 29ENTRY_STANDARD_DEVIATIONS = 2
 30MAX_TRADE_BARS = 7
 31TRADE_QUANTITY_A = 3
 32TRADE_QUANTITY_B = 4
 33
 34# Prepare data
 35#S0
 36subscription = bridge.subscribe_to_chart_data(
 37    key = 'A',
 38    base_data = [constants.SCBaseData.SC_LAST],
 39    sg_data = [SubgraphQuery(ADD_ADDITIONAL_SYMBOL_STUDY_ID, [4])],
 40    on_bar_close = True,
 41    historical_init_bars = LOOKBACK_PERIOD,
 42    realtime_update_bars = LOOKBACK_PERIOD
 43)
 44
 45response_queue = bridge.get_response_queue()
 46
 47bars_since_entrance = 0
 48
 49last_zscore = 0
 50
 51while (True):
 52    response_a = response_queue.get()
 53
 54    prices_a = response_a.as_df()['Last']
 55    prices_b = response_a.as_df()['ID1.SG4']
 56
 57    position_a = bridge.get_position_status('A').position_quantity
 58
 59    # Calculate indicators from the data
 60
 61    spread = prices_a / prices_b
 62
 63    avg = spread.mean()
 64    stdev = spread.std()
 65
 66    zscore = (spread.iloc[-1] - avg) / stdev
 67
 68    # Generate signals
 69
 70    entry_signal = get_entry_signal(zscore, last_zscore)
 71
 72    exit_signal = get_exit_signal(zscore, last_zscore)
 73
 74    timeout_signal = bars_since_entrance > MAX_TRADE_BARS
 75
 76    # Trade the signals
 77
 78    if position_a == 0:
 79        # Not in the market
 80        if entry_signal == 1:
 81            # Long the spread
 82            bridge.submit_order(
 83                key = 'A',
 84                is_buy = True,
 85                quantity = TRADE_QUANTITY_A)
 86            bridge.submit_order(
 87                key = 'B',
 88                is_buy = False,
 89                quantity = TRADE_QUANTITY_B)
 90            bars_since_entrance = 1
 91
 92        elif entry_signal == -1:
 93            # Short the spread
 94            bridge.submit_order(
 95                key = 'A',
 96                is_buy = False,
 97                quantity = TRADE_QUANTITY_A)
 98            bridge.submit_order(
 99                key = 'B',
100                is_buy = True,
101                quantity = TRADE_QUANTITY_B)
102            bars_since_entrance = 1
103
104    else:
105        # We are in the market
106        if timeout_signal or exit_signal:
107            # Exit position
108            bridge.flatten_and_cancel('A')
109            bridge.flatten_and_cancel('B')
110        else:
111            # Still in the market
112            bars_since_entrance += 1
113
114    last_zscore = zscore