Hello, World!#
This guide details how to set up Sierra Chart to work with SC-Py and shows you how to fetch your first piece of data from a chart. Before starting this, make sure you have finished installing all of the requirements by following the Setup guide.
Setting Up Sierra Chart#
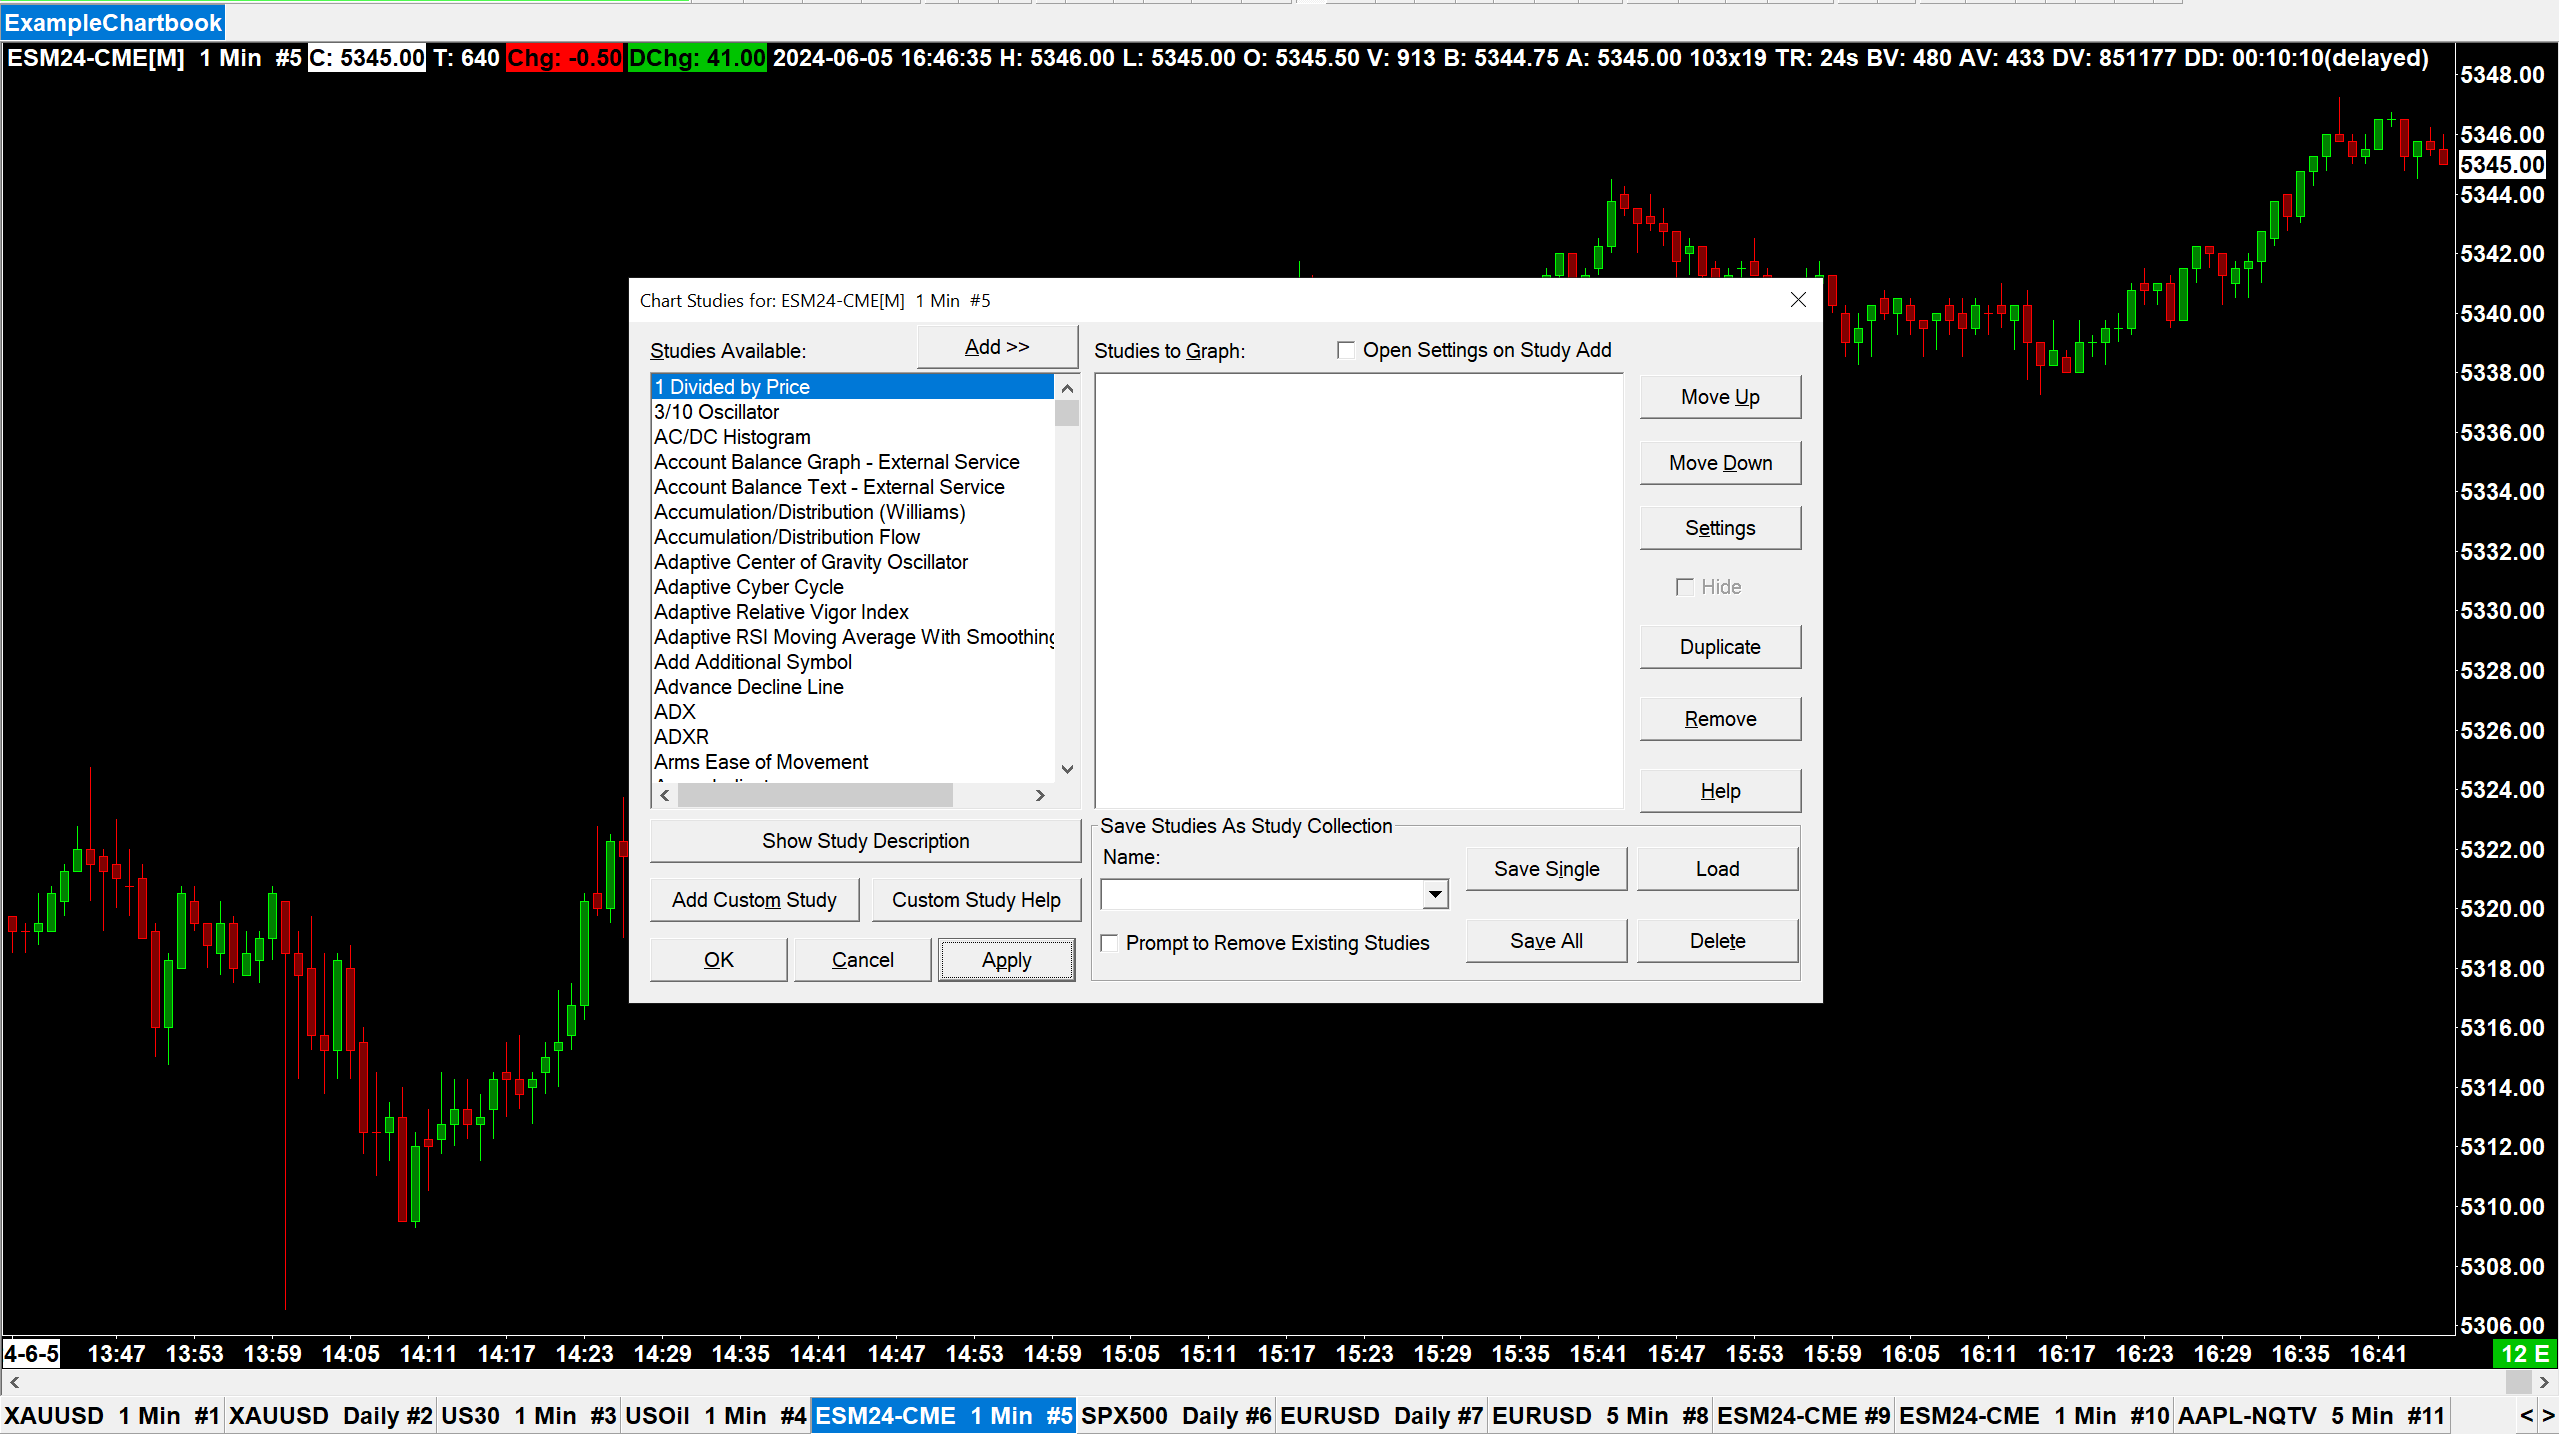
In a clean chart, go to Analysis>Studies in the top bar (or hit F6 on the keyboard).
Background
This guide is written with a 1 minute ESM24-CME chart, but in theory you can follow along with any chart.
Verify that the studies list is empty, as pictured below.
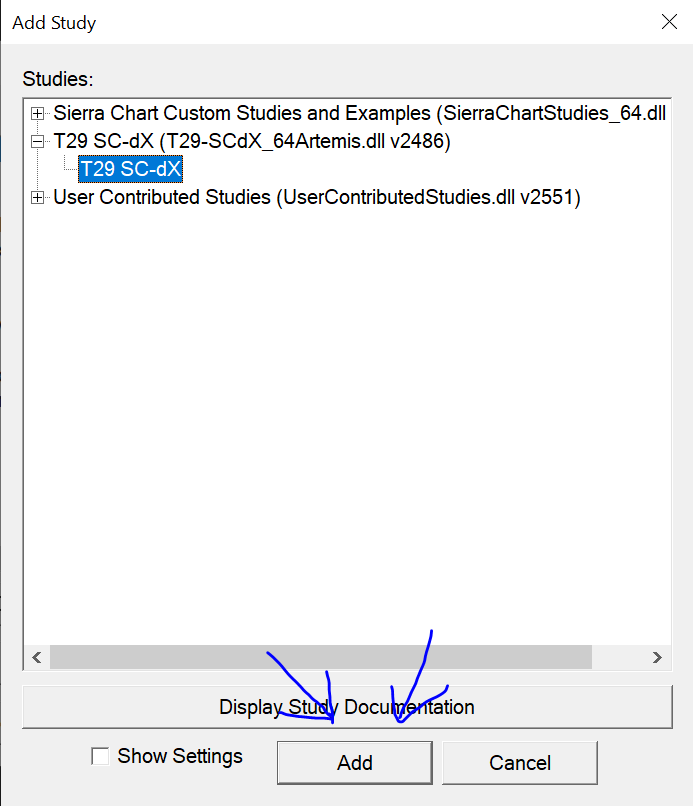
Click on add custom study, and after expanding the item labeled T29 SC-dX, select T29 SC-dX and hit Add at the bottom of the window.
Now that the study has been added, select it in the study list and hit the Settings button. For this custom study in Sierra Chart and our Python library to communicate, they need to share the same key. In the study settings menu, set the key to helloworld.
Press Ok to confirm the study’s settings and Ok once more to return to the chart view.
Sierra Chart should now be set up to send data to the Python library.
The Bridge#
In a Python shell:
>>> from trade29.sc import SCBridge
>>> bridge = SCBridge()
running bridge v0.15.0
connecting to sc
starting reciever
starting sender
sc version: 2638, scdx version 202, connection: t29scdx2, keys: helloworld
This creates a new SCBridge object. The SCBridge is the main interface between the SC-dX custom study and Python.
We are now going to fetch our very first piece of data with the SCBridge.get_chart_data(key: str, ...) method. In the same shell:
>>> from trade29.sc import constants
>>> response = bridge.get_chart_data(key='helloworld', base_data=[constants.SCBaseData.SC_HIGH])
By default, get_chart_data gets the last 10 bars of historical data. We pass it in the correct key and a list of SCBaseData to get, in this case telling it to only get the price high of the chart.
You can print this response object and see that it is a very lengthy and complicated dictionary:
>>> print(response)
<super convoluted dict>
Instead of working with this dictionary, the ChartDataResponse has a handy method that returns the response as a pandas DataFrame:
>>> df = response.as_df()
>>> df
Looking at this DataFrame is much easier on the eyes, and for those familiar with the pandas Python library it is much easier to work with.
Congratulations! You have successfully pulled your first bit of data from Sierra Chart into Python. To learn more about fetching data and subscribing to constant updates, read the guide on Fetching Market Data.